
Land Use
Plot Size (m2)
Avg. Selling Price (KD)
Total Revenues
Residential Buildings
594,552
800
475,641,600
Villa Development
594,552
300
178,365, 600
Mixed Use
686,022
2,500
1,715,055,000
Offices
182,939
6,000.0
1,097,634,000
Hotels
228,674
2,500
571,685,000
TOTAL
4,573,478
4,038,381,200
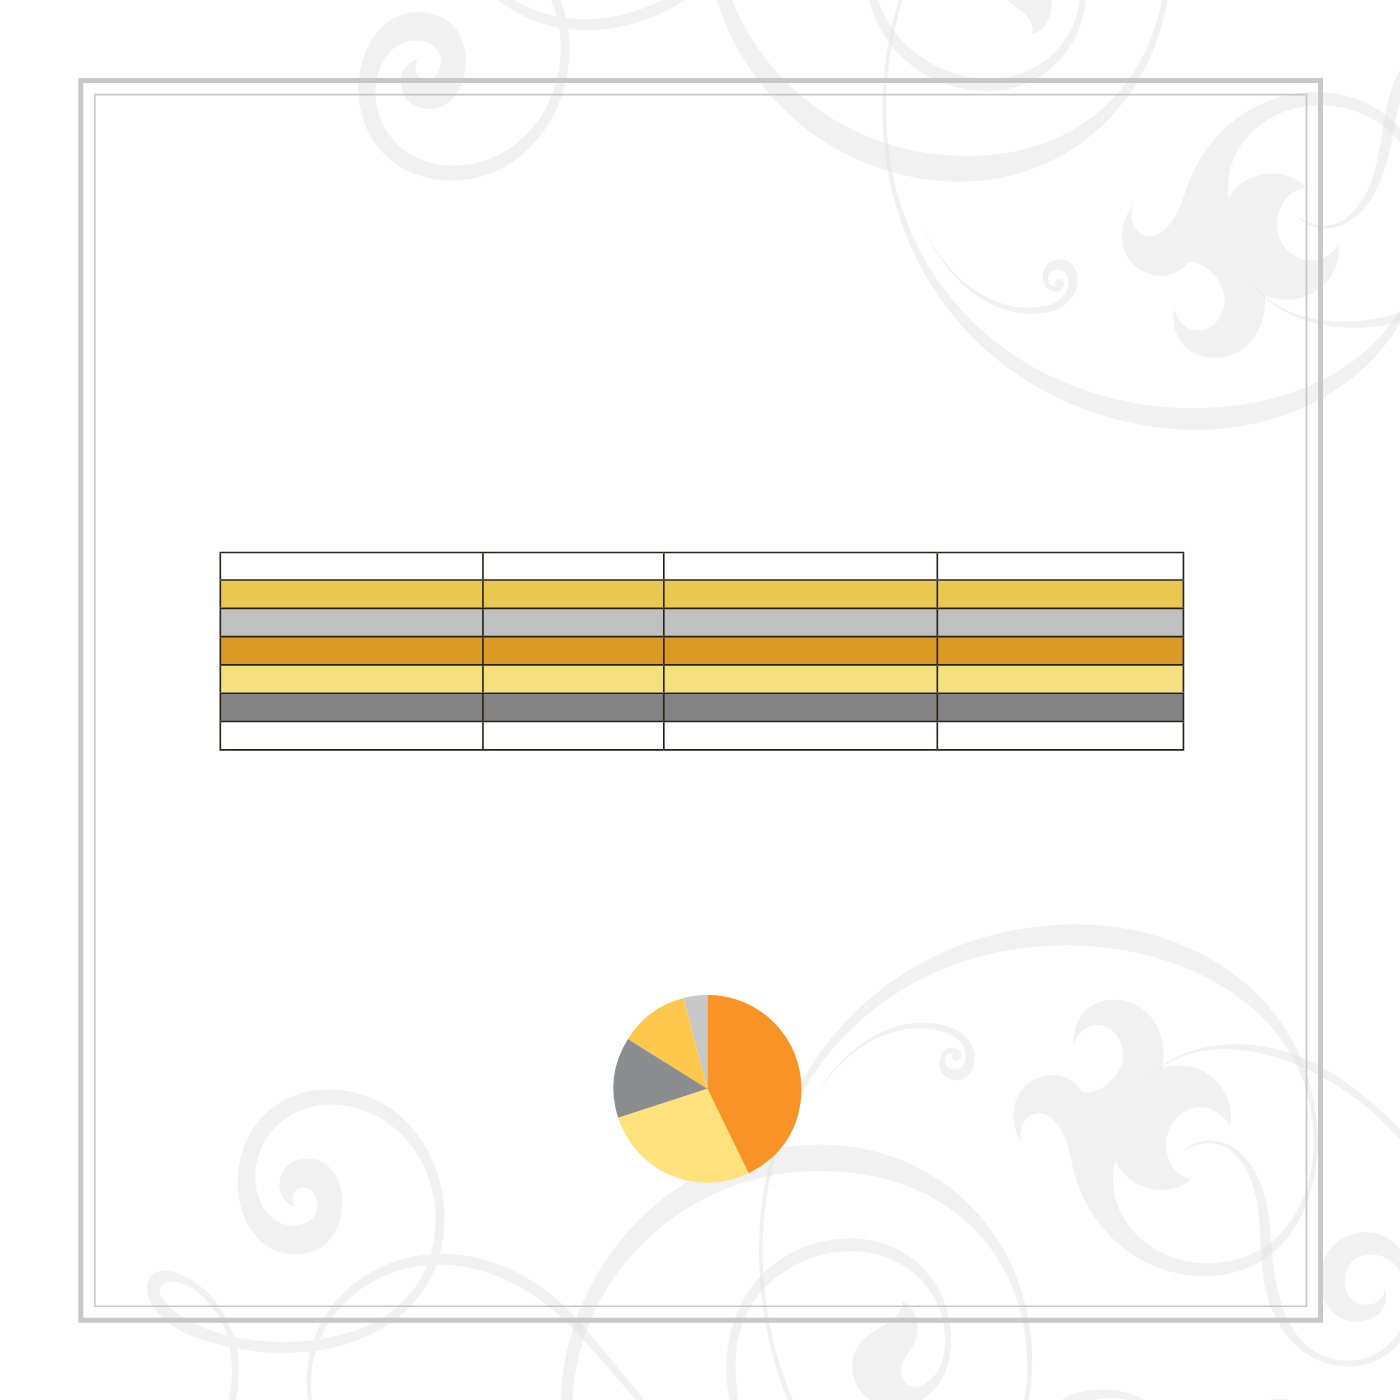
Expected Revenues Generated
The expected revenue for the Neira Financial Hub will only be acquired throughout the second phase of the project, where
land is sold only after the reclamation and the infrastructure work is done. The rundown of the revenue is concluded on
different land use and with comparison to the average selling price of the current market rate. The revenues breakdown by
sector is illustrated below with the estimated selling price per m2:
Expected Revenue Breakdown
Hotels 14%
Residential Buildings 12%
Villa Plots 4%
Mixed Use 43%
Offices 27%
Neira Financial Hub | 41


