
Page 45 - FS-Q2-2023-EN
P. 45
AL-MAZAYA HOLDING COMPANY - K.S.C. (PUBLIC)
AND ITS SUBSIDIARIES
NOTES TO THE CONSOLIDATED FINANCIAL STATEMENTS
JUNE 30, 2023
(All amounts are in Kuwaiti Dinar)
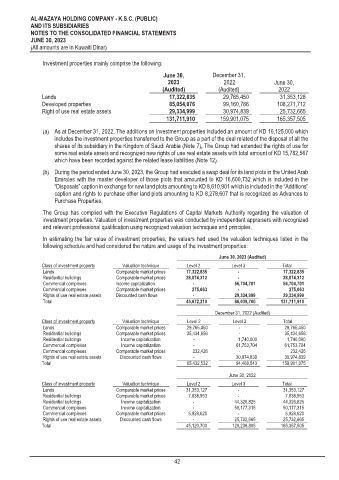
Investment properties mainly comprise the following:
June 30, December 31,
2023 2022 June 30,
(Audited) (Audited) 2022
Lands 17,322,835 29,765,450 31,353,128
Developed properties 85,054,076 99,160,786 108,271,712
Right of use real estate assets 29,334,999 30,974,839 25,732,665
131,711,910 159,901,075 165,357,505
(a) As at December 31, 2022, The additions on investment properties included an amount of KD 10,125,000 which
includes the investment properties transferred to the Group as a part of the deal related of the disposal of all the
shares of its subsidiary in the Kingdom of Saudi Arabia (Note 7), The Group had extended the rights of use for
some real estate assets and recognized new rights of use real estate assets with total amount of KD 15,782,567
which have been recorded against the related lease liabilities (Note 12).
(b) During the period ended June 30, 2023, the Group had executed a swap deal for its land plots in the United Arab
Emirates with the master developer of those plots that amounted to KD 16,600,732 which is included in the
“Disposals” caption in exchange for new land plots amounting to KD 8,610,901 which is included in the “Additions”
caption and rights to purchase other land plots amounting to KD 8,278,607 that is recognized as Advances to
Purchase Properties.
The Group has complied with the Executive Regulations of Capital Markets Authority regarding the valuation of
investment properties. Valuation of investment properties was conducted by independent appraisers with recognized
and relevant professional qualification using recognized valuation techniques and principles.
In estimating the fair value of investment properties, the valuers had used the valuation techniques listed in the
following schedule and had considered the nature and usage of the investment properties:
June 30, 2023 (Audited)
Class of investment property Valuation technique Level 2 Level 3 Total
Lands Comparable market prices 17,322,835 - 17,322,835
Residential buildings Comparable market prices 28,074,312 - 28,074,312
Commercial complexes Income capitalization - 56,704,701 56,704,701
Commercial complexes Comparable market prices 275,063 - 275,063
Rights of use real estate assets Discounted cash flows - 29,334,999 29,334,999
Total 45,672,210 ¤ 86,039,700 131,711,910
December 31, 2022 (Audited)
Class of investment property Valuation technique Level 2 Level 3 Total
Lands Comparable market prices 29,765,450 - 29,765,450
Residential buildings Comparable market prices 35,434,656 - 35,434,656
Residential buildings Income capitalization - 1,740,000 1,740,000
Commercial complexes Income capitalization - 61,753,704 61,753,704
Commercial complexes Comparable market prices 232,426 - 232,426
Rights of use real estate assets Discounted cash flows - 30,974,839 30,974,839
Total 65,432,532 94,468,543 159,901,075
June 30, 2022
Class of investment property Valuation technique Level 2 Level 3 Total
Lands Comparable market prices 31,353,127 - 31,353,127
Residential buildings Comparable market prices 7,838,953 - 7,838,953
Residential buildings Income capitalization - 44,326,825 44,326,825
Commercial complexes Income capitalization - 50,177,315 50,177,315
Commercial complexes Comparable market prices 5,928,620 - 5,928,620
Rights of use real estate assets Discounted cash flows - 25,732,665 25,732,665
Total 45,120,700 ¤ 120,236,805 165,357,505
42