
Page 57 - Q4-2024-EN
P. 57
AL-MAZAYA HOLDING COMPANY - K.S.C. (PUBLIC)
AND ITS SUBSIDIARIES
NOTES TO THE CONSOLIDATED FINANCIAL STATEMENTS
DECEMBER 31, 2023
(All amounts are in Kuwaiti Dinars)
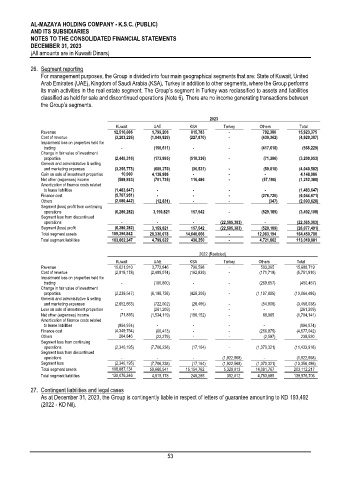
26. Segment reporting
For management purposes, the Group is divided into four main geographical segments that are: State of Kuwait, United
Arab Emirates (UAE), Kingdom of Saudi Arabia (KSA), Turkey in addition to other segments, where the Group performs
its main activities in the real estate segment. The Group’s segment in Turkey was reclassified to assets and liabilities
classified as held for sale and discontinued operations (Note 6). There are no income generating transactions between
the Group’s segments.
2023
Kuwait UAE KSA Turkey Others Total
Revenue 12,516,006 1,799,206 815,783 - 792,380 15,923,375
Cost of revenue (3,203,226) (1,049,929) (227,870) - (439,362) (4,920,387)
Impairment loss on properties held for
trading - (150,611) - - (417,618) (568,229)
Change in fair value of investment
properties (2,445,316) (173,995) (510,336) - (71,306) (3,200,953)
General and administrative & selling
and marketing expenses (3,255,773) (689,270) (36,521) - (59,018) (4,040,582)
Gain on sale of investment properties 10,000 4,138,986 - - - 4,148,986
Net other (expenses) income (569,933) (701,735) 116,486 - (57,198) (1,212,380)
Amortization of finance costs related
to lease liabilities (1,483,647) - - - - (1,483,647)
Finance cost (5,767,951) - - - (276,720) (6,044,671)
Others (2,080,442) (12,831) - - (347) (2,093,620)
Segment (loss) profit from continuing
operations (6,280,282) 3,159,821 157,542 - (529,189) (3,492,108)
Segment loss from discontinued
operations - - - (22,585,383) - (22,585,383)
Segment (loss) profit (6,280,282) 3,159,821 157,542 (22,585,383) (529,189) (26,077,491)
Total segment assets 109,396,842 28,330,078 14,640,666 - 12,083,194 164,450,780
Total segment liabilities 103,062,347 4,799,622 436,250 - 4,721,662 113,019,881
2022 (Restated)
Kuwait UAE KSA Turkey Others Total
Revenue 10,621,910 3,772,846 790,598 - 503,365 15,688,719
Cost of revenue (2,918,178) (2,499,074) (162,839) - (171,719) (5,751,810)
Impairment loss on properties held for
trading - (180,800) - - (269,657) (450,457)
Change in fair value of investment
properties (2,239,547) (6,198,738) (428,306) - (1,197,895) (10,064,486)
General and administrative & selling
and marketing expenses (2,652,663) (722,002) (28,465) - (54,908) (3,458,038)
Loss on sale of investment properties - (261,209) - - - (261,209)
Net other (expenses) income (71,835) (1,534,119) (188,152) - 89,965 (1,704,141)
Amortization of finance costs related
to lease liabilities (994,974) - - - - (994,974)
Finance cost (4,349,754) (60,413) - - (266,875) (4,677,042)
Others 264,846 (22,279) - - (2,597) 239,520
Segment loss from continuing
operations (2,340,195) (7,706,238) (17,164) - (1,370,321) (11,433,918)
Segment loss from discontinued
operations - - - (1,922,568) - (1,922,568)
Segment loss (2,340,195) (7,706,238) (17,164) (1,922,568) (1,370,321) (13,356,486)
Total segment assets 108,887,134 59,660,541 15,154,762 5,328,013 14,081,767 203,112,217
Total segment liabilities 130,076,346 4,515,178 248,285 352,012 4,783,885 139,975,706
27. Contingent liabilities and legal cases
As at December 31, 2023, the Group is contingently liable in respect of letters of guarantee amounting to KD 193,492
(2022 - KD Nil).
53